Vibrant EMS is an industrial energy management system we developed ourselves. It reads your energy meters through the Siemens PLCs already in your plant, keeps the history on site, and shows consumption, demand, power factor and cost broken down by zone, meter and shift.
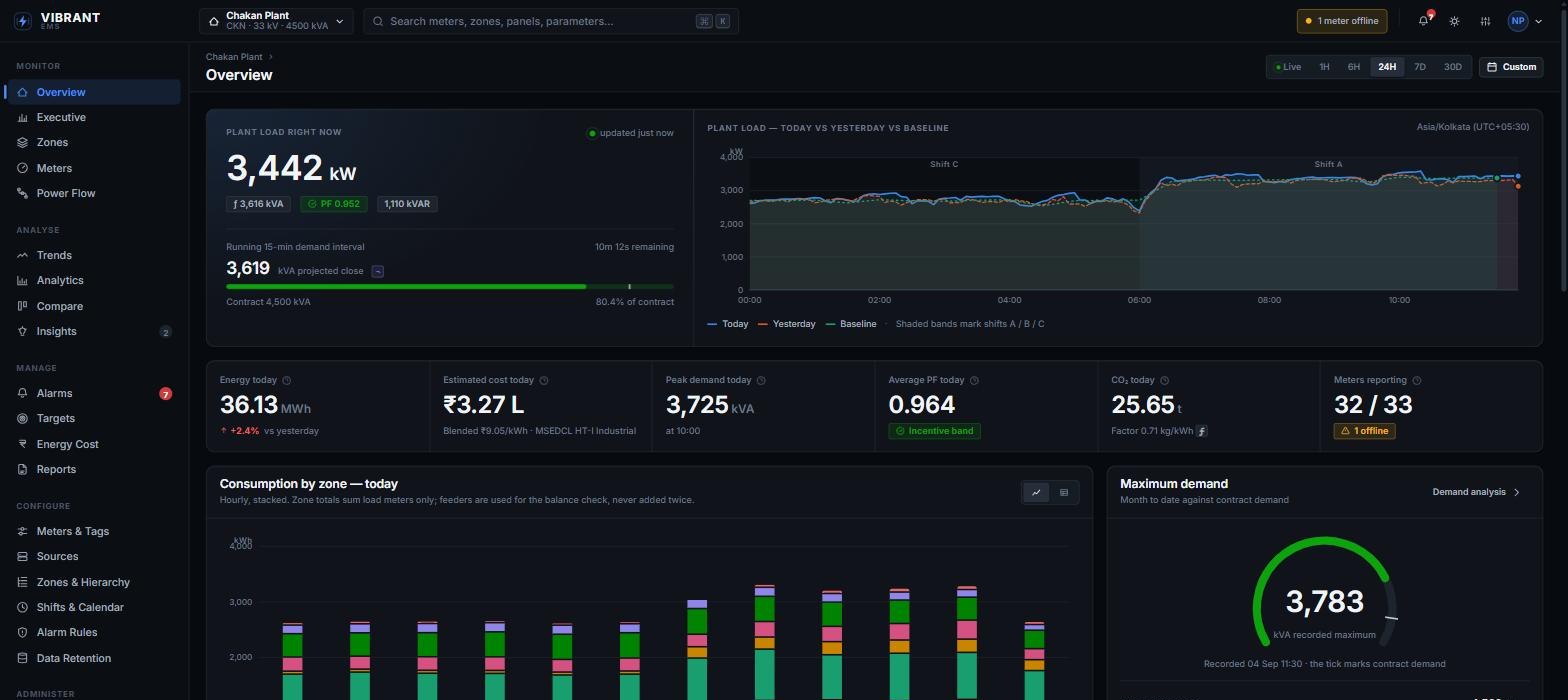
Almost every plant we walk into already has energy meters, and almost none of them can answer the question the finance team actually asks: which part of this plant caused the bill to go up this month? Vibrant EMS exists to answer that.
Demand is tracked through the running 15-minute interval with a projected close, so the excursion can be stopped while it is still happening — not explained after the penalty appears on the invoice.
Power factor is watched per incomer and per transformer against the incentive threshold, with the duration below it recorded. That duration is the evidence for a capacitor investment.
Consumption is costed against your configured tariff and split by zone, shift and asset, so a department sees its own number rather than a plant-wide total nobody owns.
Consumption by plant, zone, panel, feeder and individual meter, at hourly, shift, daily, monthly and yearly resolution. The hierarchy is your hierarchy — configured, not hard-coded.
Period comparison day-on-day, week-on-week and against the same weekday, plus a statistical baseline that states its sample size rather than quietly guessing.
An energy-balance chain from the utility incomer down to zone totals, showing transformer and distribution losses explicitly instead of absorbing them into a zone.
Rules on demand, power factor, voltage, imbalance, communication and threshold breach, with severity, acknowledgement and a full event history.
Daily, shift, weekly and monthly reports built once and mailed automatically to the people who need them — the feature customers name first when we ask what changed.
Continuous topology checks catch CT ratio errors, double-counted meters and unmetered load by comparing a feeder against the meters beneath it.
The overview below is a single unbroken capture of one screen — live load and demand projection, the day’s headline figures, consumption stacked by zone, the ranked consumers, what needs attention, and the energy-flow chain from the 33 kV incomer down to every zone.
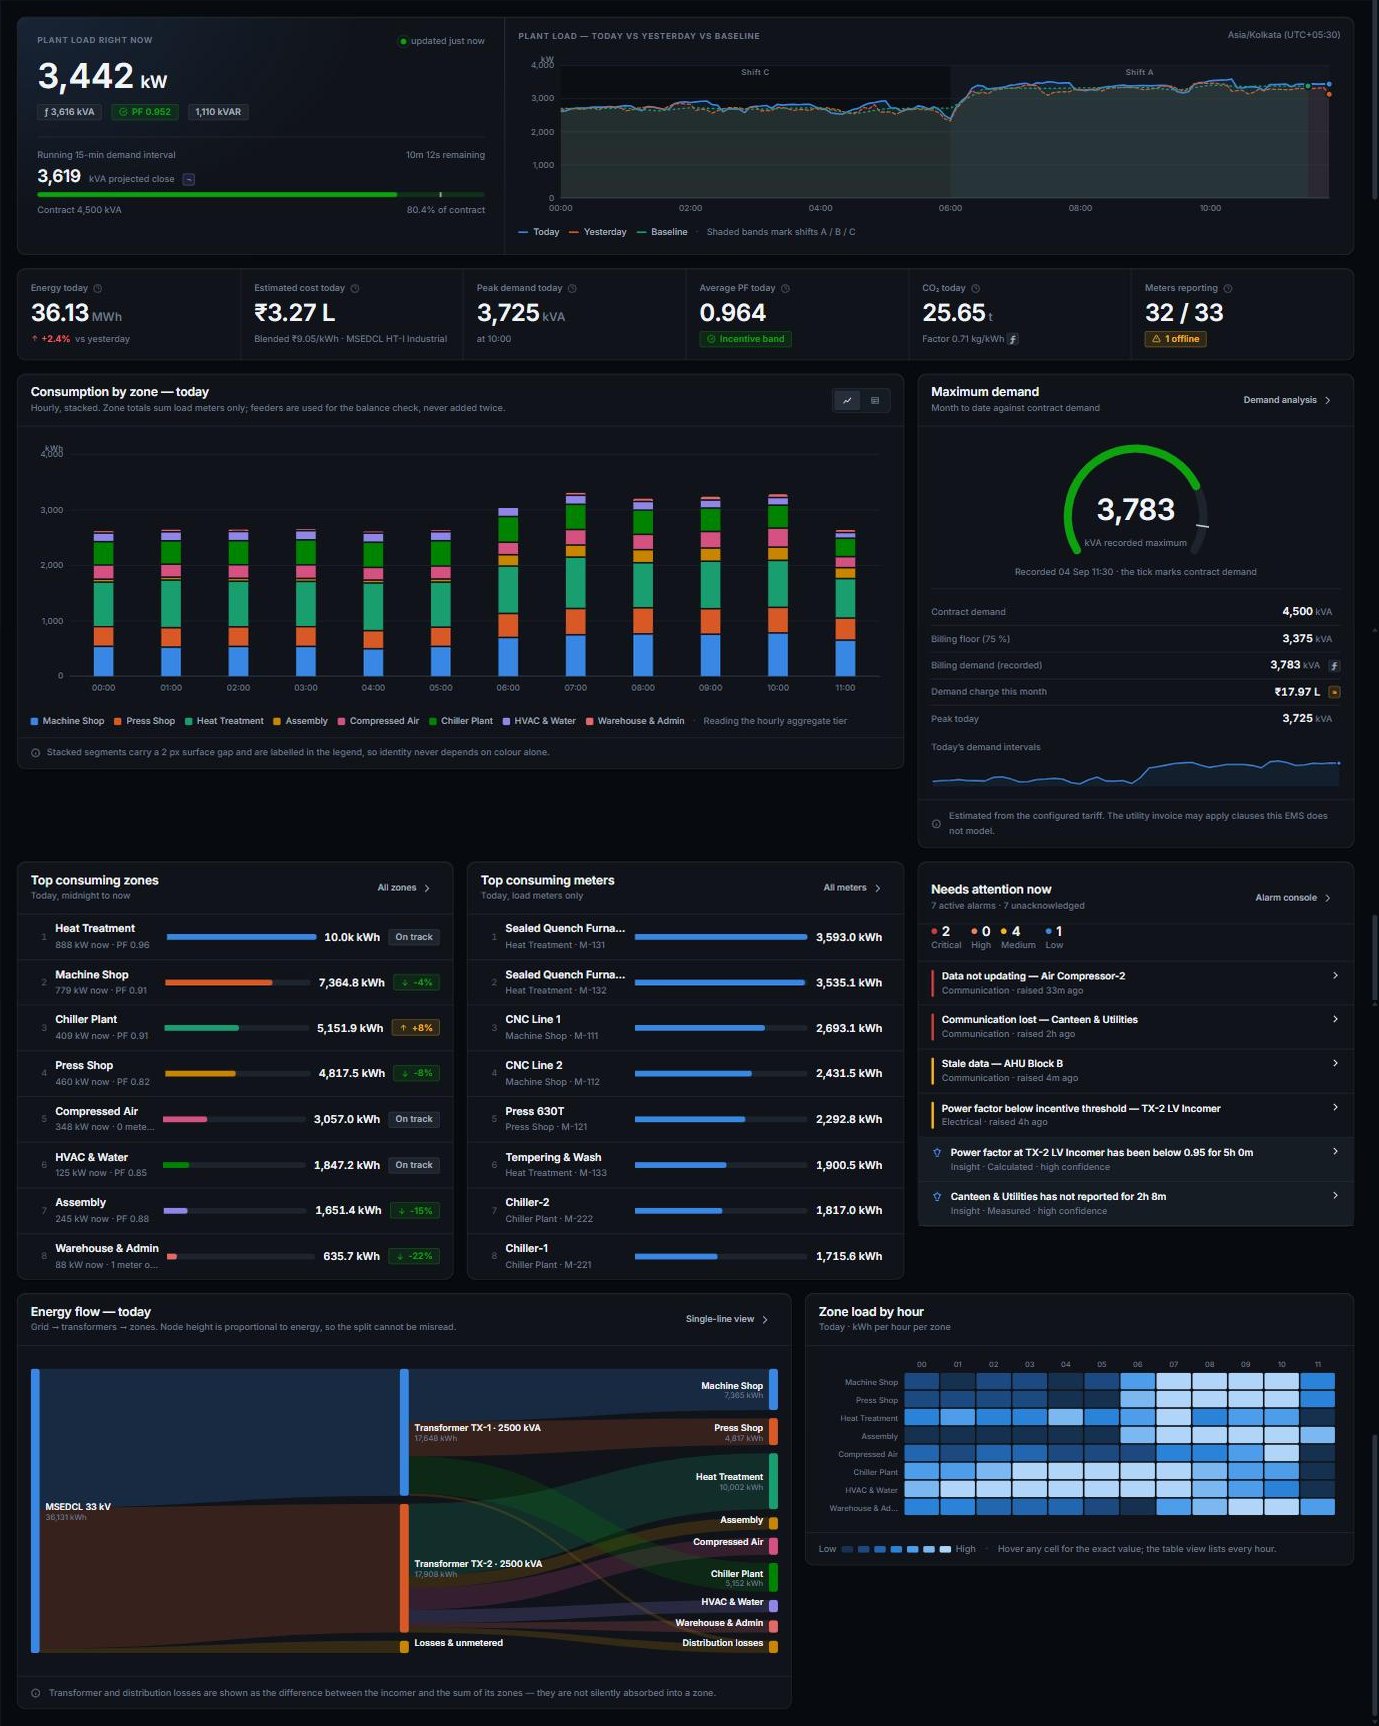
Most energy dashboards quietly absorb transformer and distribution losses into whichever zone makes the totals balance. This one states them, because a rising loss figure is itself a finding.
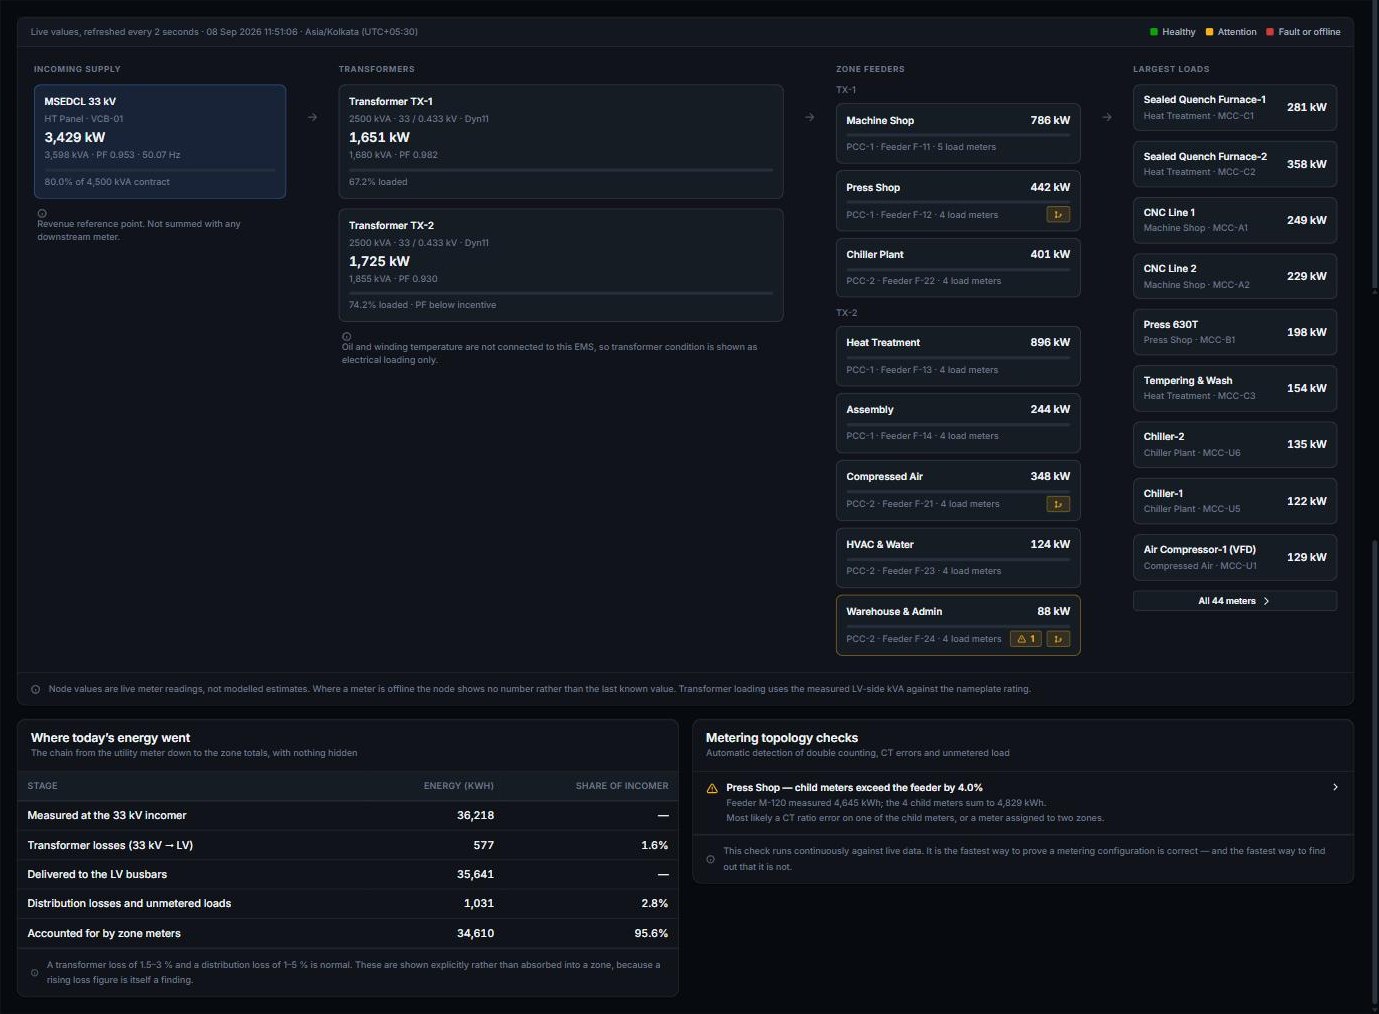
Any energy dashboard can draw a chart. The difference shows up the day someone challenges a figure in a management review or a bill dispute. Four rules are enforced in the data layer, not painted on at the end:
A value that was not measured renders as a dash and is excluded from sums — it never silently becomes a zero that drags an average down.
If a reading is older than three poll intervals it is greyed and stamped with the time it was actually taken.
An aggregate computed over an incomplete set says so, rather than quietly shrinking and looking like a saving.
Each value carries where it came from. A derived figure shows its formula; an estimate shows its method; a forecast shows its confidence.
Your energy meters report into a Siemens S7 data block by whichever route they already use. Where a meter or CT is missing we supply and wire it, sizing the CT before anything is ordered.
The collector reads DB offsets directly and never writes to the CPU — read access is all it is given, and that is what goes on the commissioning sheet.
Two TIA settings decide whether a direct read is possible at all. Our Siemens-certified engineers make those changes, compile and download — and if the CPU refuses a read, the software says exactly which of the two is wrong instead of “connection failed”.
One node for a single plant; collectors at each site reporting to a central historian for a group. Multi-plant is built in from the start, not bolted on later.
We map what is already metered, what is not, and where the unmetered load is hiding. You get the metering gap list whether or not you go ahead.
The main incomer plus one department, read through your existing CPU. Enough to prove the numbers against your own utility bill before the scope grows.
Remaining meters, the zone hierarchy, your tariff and shift calendar, alarm thresholds agreed with the electrical team, and the reports that should arrive automatically.
Your engineers trained to add meters and edit the hierarchy themselves, with the commissioning sheet, CT schedule and DB layout documented.
Usually not. If your meters already report to a Siemens S7-1200 or S7-1500 over Modbus, PROFINET, PROFIBUS or direct IO, Vibrant EMS reads them straight from the PLC data blocks. Where meters are missing we supply and wire them, with the CT sizing worked out first.
A meter tells you what one panel did. An EMS tells you what the plant did — by zone, by shift, by product, against a target and against a tariff — and keeps that history so a claim can be checked a year later.
No, and any system that promises that is misleading you. It gives an estimated cost from the tariff you configure, clearly labelled as an estimate. Utility invoices apply clauses no EMS models. What it does do well is show you which zone, shift or asset caused the cost.
Nothing is invented. A missing value is shown as a dash, never as zero, and it is excluded from totals. Any total computed over an incomplete set states its coverage, so you always know what a number is actually made of.
Not from electrical data alone, and we will not claim otherwise. It can detect abnormal consumption, degrading power factor, load imbalance and demand excursions. Equipment failure prediction needs vibration and temperature — that is what our Condition Monitoring solution is for.
On your machine, inside your plant. The collector runs on a plant PC or edge device, the history stays local, and no internet connection is required for it to work.
We will tell you what Vibrant EMS would meter first, what it would likely find, and what a pilot on one incomer costs — before you commit to anything.